AI-powered analytics for
DSOs & dental groups
The intelligence layer for dental groups. Know exactly which marketing channels are driving your highest-value new patients, which providers are leading on case acceptance, and where your portfolio is leaving production on the table.
HIPAA compliant · BAA available · Live in days
marketing, finance, and clinical systems
Compliant
for every customer
operators across 100+ brands
Most DSOs are sitting on data and insights they can't easily access.
Your PMS, marketing tools, and financial systems each hold a piece of the puzzle. CorralData brings it all together — automatically, in real time.
Data fragmented across too many tools
Dentrix doesn't talk to QuickBooks. Google Ads doesn't talk to your PMS. Building a complete picture requires connecting dots that were never designed to connect.
No visibility into underperforming locations
Two of your locations are quietly struggling — high no-shows, low case acceptance, chair utilization falling. You won't find out until the monthly review, and by then you've lost $40K in production.
Recare patients slipping through the cracks
Your PMS has thousands of overdue patients with no prioritized list and no revenue value attached. Every month, recoverable revenue walks out the door.
Marketing spend with no clear ROI
You can see leads from Google Ads and Meta — but not how many became booked exams, showed up, and accepted treatment. You're optimizing on vanity metrics, not revenue.
Month-end reports that take forever
Your team spends 3 days pulling data from five tools just to answer "how are we doing?" By the time it's done, the data is already stale.
Every metric your group and team actually needs — live from day one
These aren't generic charts. Every dashboard is built around how DSOs and dental groups actually operate — connected to your PMS and ready on day one. Every view includes Instant Insights and the AskCorral agent — an AI that answers your questions and surfaces what to do next based on your data and trends.
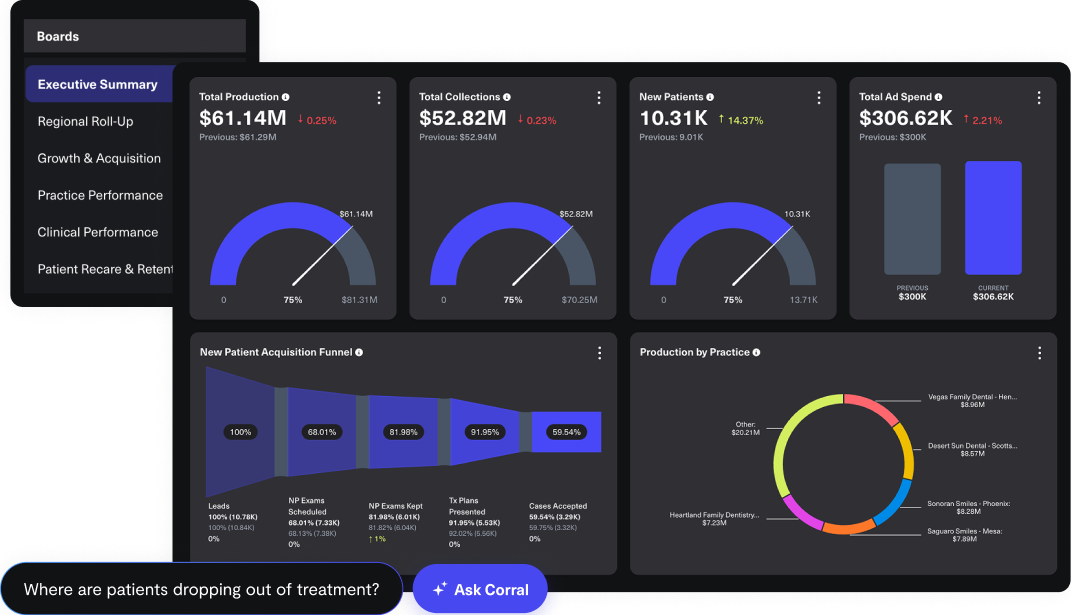
Executive Summary
The view your leadership team needs every morning — production, collections, new patients, CAC, case acceptance, and chair utilization, all in real time.
Marketing & New Patient Funnel
See exactly where new patients come from, where they drop off, and what each acquisition actually costs — from first click to case accepted.
Clinical Performance
Provider scorecards, chair utilization, hygiene reappointment, and cancellation tracking — everything your clinical leadership needs to run a tight, profitable operation.
Patient Recare & Retention
See exactly how many patients are overdue, what that's worth in unscheduled treatment, and which locations have the biggest recovery opportunity.
What DSOs and dental groups actually do with CorralData
From growing dental groups to PE-backed DSOs managing 50+ locations — here's how teams use CorralData every day.
Morning Huddle, Automated
CorralData generates your daily huddle report with yesterday's production, today's schedule fill, and flagged anomalies — before the first patient walks in.
Marketing Funnel Visibility
Track every lead from Google Ads, Meta, or referral through booking, show, and case acceptance — with true CAC per channel, not just cost-per-lead.
Provider Performance Scorecards
See exactly how each provider is tracking on production, case acceptance, and hygiene reappointment — before your monthly review, not after.
Recare & Recall Recovery
See exactly which overdue patients to call, in what order, with the dollar value of their unscheduled treatment — a prioritized list, not a random PMS export.
Portfolio Roll-Up for DSOs
Real-time roll-up of production, collections, EBITDA, and KPIs across every location — with drill-down to understand what's driving variance.
RCM & Collections Visibility
Track collection rate by location, provider, and procedure. Spot insurance aging issues before they become write-offs and get ahead of revenue leakage.
From scattered data to actionable intelligence
Connect your PMS to your entire tool stack
CorralData connects to your existing PMS, marketing platforms, financial systems, and more — no rip-and-replace required.
Built for clinical-grade data.
HIPAA compliance, dedicated infrastructure, governed AI access, and row-level security — built into the foundation, not bolted on.
HIPAA Compliant
We sign a Business Associate Agreement (BAA) with every customer before data flows. Your patient data is handled in full compliance with HIPAA — this is standard, not optional, for every CorralData engagement.
Dedicated Instance
Every customer gets their own isolated data warehouse — not a shared multi-tenant environment. Your portfolio data stays completely segregated from other customers.
Zero AI Data Retention
Your data never trains LLMs. When AI agents analyze your dashboards or surface insights, that data is processed in isolation and never used to improve third-party models.
Row-Level Security
Corporate HQ sees the full portfolio roll-up. Location operators see only their locations. Clinical, finance, and ops roles each get appropriately scoped views — managed centrally.
Make your data
work for you.
Book a 30-minute demo and see a live dashboard built for your portfolio — with your actual KPIs, in real time.
Book a Demo →Common questions about CorralData for dental.
CorralData connects to the PMS your group runs on. Every DSO's tech stack is different — we build the connection to your specific system, no engineering lift on your end. Beyond PMS, we integrate with 600+ platforms covering marketing (Google Ads, Meta), finance (QuickBooks, Sage Intacct, NetSuite), HR (Gusto, ADP), and call tracking. Book a demo and tell us your stack.
Most DSOs and dental groups are live and running dashboards within a few days of signing. CorralData's team handles everything — PMS connection, data normalization, business logic mapping, and KPI configuration. You don't need to touch a line of code or configure a single pipeline.
No. CorralData is built for dental operators, not data scientists. Our white-glove onboarding team sets up your dashboards, defines your KPIs, and configures everything to match how your group operates. Your leadership and clinical teams can read the dashboards — no SQL required.
Yes. CorralData is fully HIPAA compliant with enterprise-grade security, end-to-end encryption, role-based access controls, audit logging, and a signed Business Associate Agreement (BAA) available for every customer.
CorralData is purpose-built for multi-location scale. Whether you're operating 5 locations or 200, the platform handles portfolio roll-ups, location benchmarking, regional scorecards, and EBITDA tracking across every location in one unified view. As your group grows — through organic expansion or acquisition — new locations are onboarded into the existing data model in days, not months.